Not all gas is made equal
Natural gas is a natural phenomenon. Wherever it is produced, the fossil gas mixture is predominantly composed of methane. It has been used in the Netherlands (NL) for 60 years to heat homes and power industry. Now, due to its climate impact, natural gas is scheduled to be phased out.
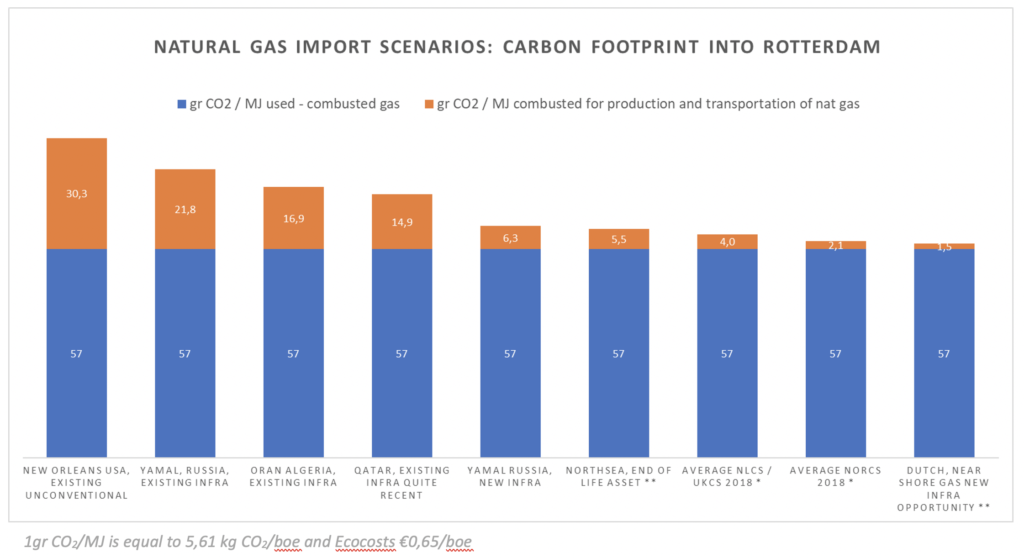
NL’s large onshore gasfields will be decommissioned in the coming years and the country will need to import gas during a 30 year transition period. The life cycle assessment (LCA) carbon footprint of importing natural gas to NL during that period varies according to available sea/land transportation options and local production techniques. The corresponding carbon footprint of NL’s near-shore production and transportation is about 20 times less than gas produced in and imported from the USA. And Russian gas imports through new infrastructure and the Nord Stream 2 pipeline will still produce 4 times the impact of gas produced in NL. In our urgent actions to reduce climate impact, every percent reduction in NL’s footprint counts. We need to avoid importing extra pollution through the back door!
The graph above, a result of extensive investigation and interpretation of existing scientific LCA studies and calculations, illustrates that a portion of the CO2 from combusted natural gas (blue section) can be captured and stored beneath the seabed (CCS) as an intermediate solution. However, the significant climate impact from gas production and transportation, measured per country and production technology (orange section), cannot be captured! Hence, in terms of CO2 climate impact, deciding between natural gas development in NL versus importing it from elsewhere is problematic. The origins of gas with a lower environmental footprint should have a higher value!
All values are life cycle based except for the average NLCS, UKCS and NORCS. These values (*) are based on actual annual emissions of both oil and gas production assets.
Life cycle based environmental burden values implies the inclusion of natural gas production (construction, production and decommissioning), transportation and final use.
The name of the ** gas production assets in the graph are known by the author