What can entrepreneurs expect in terms of profitability knowing that society, governments, clients, partners and financial institutions increasingly share the same thoughts on protecting the environment against pollution?
The use of oil and gas by society in Europe and beyond will gradually be reduced over the next twenty, thirty years. The companies producing the fossil fuels today will as a result need to adapt to this new reality and strengthen its policy for the transition period to produce fuels cleaner and developing renewable alternatives. What is the result of implementing such a policy on company future fitness?
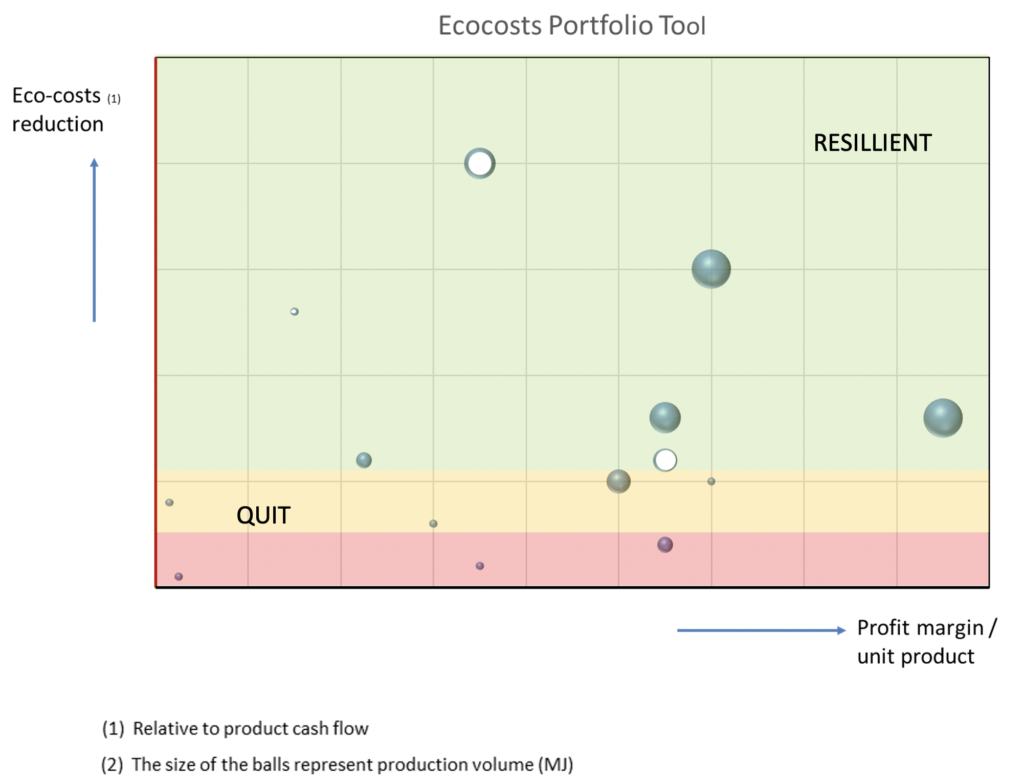
Sustainable Endeavour, in closely cooperation with an energy company, visualized in one graph the key factors for company future fitness: the expected profitability and the associated environmental burden (Eco-costs) of its oil and gas producing assets over its remaining life time. Hence the graph looks into the future with the knowledge of today. The information in the graph (fictitious company) is used to identify, decide and monitor critical new (dis) investment opportunities and modifications.

The graph shows each operational and proposed (balls with white heart) asset in the company portfolio. The size of the ball represents the owned production volume.ence On the x-axe the expected accrued profit per unit of product over the (remaining) production life time is shown. The y-axe displays the cash flow divided by the environmental burden. The environmental burden is expressed in monetary terms: Eco-costs.
When the Eco-costs is reduced the y-axe value increases. An Eco-costs reduction relative to the cash flow strengthens the asset fitness because anticipated future costs associated with the environmental burden (Eco-costs) can more comfortably be paid from the cash flow hence reducing environmental risks.
The graph shows existing production assets (balls) but also proposals for future production assets (balls with a white heart). The opportunity (white ball) in the left up corner is indeed less profitable than the other seized balls but on the other hand has a much more comfortable risk profile when it comes to environmental burden. It is future fit!
Obviously the products in the left down corner of the graph do not have a very bright future with low financial performance and high environmental risks. Projects in the upper left quarter have relative low profitability but are relatively well off in terms of environmental risk while those in the right upper corner are the cash cows for the next twenty years.
As a matter of fact this graph does not display the current state of the art but is a forward looking tool bringing expectations on future profitability and Eco-costs to the table of today. Note that due to increasingly shorter project time horizons in the oil and gas exploration business, as opposed to the renewables, the construction and decommissioning activities will have a relative high financial and environmental risk impact.
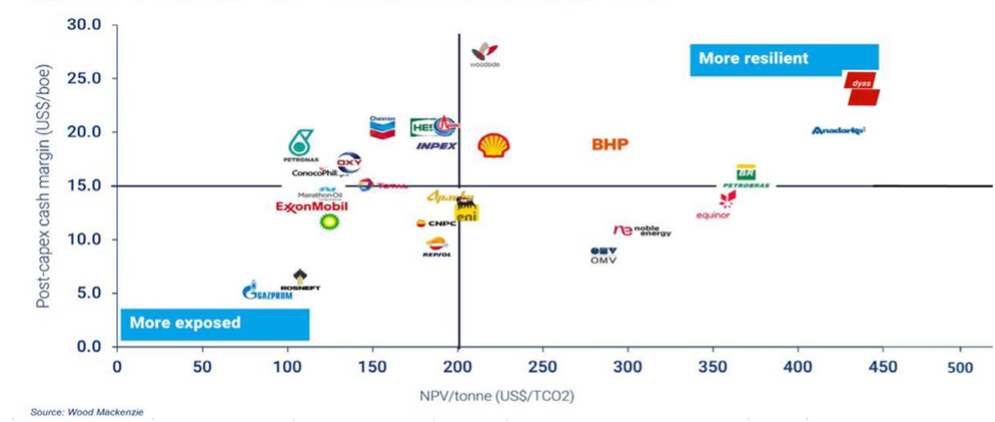
Below a slightly different graph presenting the benchmark on low – carbon and resilient oil and gas portfolio prepared by Wood Mackenzie. Note that only CO2 is taken into account and not the full range of material impacts on the environment like Sustainable Endeavour practices with Eco-costs at portfolio level. Note assuming a marginal CO2 price of US$ 200,- (which is at the high end) the companies at the left side of the cross will no longer be able to pay for the environmental costs. These companies will have to close its current business while those at the right side of the cross, provided there is a demand for their products, will survive. Use every opportunity within your firm to take future issues up in today decision making.

